
Comparing our framework to Michael Howell's
Michael thinks liquidity drives markets. We think liquidity is just another part of the Fed's myth-making.

In this piece, I apply our macro framework at TMF to Michael Howell’s (of CrossBorder Capital) views on liquidity.
This is part of a series in which we are aiming to expose our thinking by relating it to others’ perspectives we find noteworthy. In the previous edition, we looked at Jeff Snider’s views on the possibility of monetary deflation. This piece is about the possibility, proposed by Howell, of excess monetary inflation.
In a sentence, I’d describe Howell’s view on liquidity as: “Liquidity is the flow of cash-like assets throughout the financial economy, with this flow being a significant driver of asset returns.”
Our broad response would be: “Asset returns are anchored to how nominal growth expectations evolve over time, and liquidity is not a particularly meaningful or useful input to that nominal growth. Liquidity describes the nature of assets, but nominal growth is determined by the amount of assets.”
The significant (and undeserved) attention paid to liquidity since 2020, and especially in the last 18 months, can be attributed to a single chart:

The chart depicts what at first glance is a powerful result: that despite the Fed’s balance sheet reduction via QT, the Fed’s “liquidity” provision bottomed in late 2022, just as equity markets bottomed, and the rise in liquidity since must’ve at least partially supported equity markets, even as many were calling for an economic slowdown.
The goal of this piece is to reveal this chart to be largely meaningless (and misleading), and reaffirm our focus on NGDP, and the particular flows that drive NGDP. We’ll get there in sections:
Clarifying what is being referred to as liquidity
Why that means liquidity is not a useful concept
Powell “liquidity”, Yellen “liquidity”, Biden “liquidity”; only one of them matters
Our total impulse measure as the only “money flow” measure that matters
Our overarching point is: What matters isn’t the total supply of cash-like assets, it’s the total supply of all assets, because that amount is what actually determines the total amount of funds available to contribute to NGDP, which ultimately determines asset returns. Whether those assets take a cash-like form or not is secondary.
Only when a new asset-liability pair on the private sector’s balance sheet is created is there more funds available to contribute to spending, investment, or asset purchases. Any monetary operation that doesn’t expand the supply of all assets held by the private sector cannot contribute to NGDP, which means it ultimately does not matter for asset returns.
Liquidity describes the nature of assets: asset-liability pairs that are “cash-cash”. We care about the number of assets, meaning the number of total “asset-cash” pairs.
What Howell calls “monetary inflation” via central bank “liquidity injections” isn’t actually one: monetary inflation is exclusively an expansion in the total supply of assets. The central bank fundamentally cannot increase that total supply.
This truth casts doubt on the power and tools of the Fed, a doubt that the Fed cannot afford if it is to have any chance at getting the economy to obey the Fed’s stated objectives. Recognizing this, Jay Powell took the opportunity in his 2020 60 Minutes interview to “inform” the public that he had a money printer that could go “brrrr”.

“Is it fair to say you simply flooded the system with money?”
“Yes, we did. That’s another way to think about it.”
“Where does it come from? Do you just print it?”
“We print it digitally. As a central bank, we have the ability to create money, digitally. And we do that by buying Treasury bills or bonds, and that increases the money supply.”
Of course, replacing something that doesn’t count towards “Money Supply” with something else that does count will increase the “Money Supply”. Creating reserves by buying bonds just converts one form of money to another. So what we actually care about isn’t money supply, it’s “Asset Supply”. And because the Fed cannot print assets, it cannot, and does not, “print” money.
Nominal growth comes from printing assets. Powell didn’t print assets in 2020, Congress did. Powell only “flooded” the system with one kind of money by stripping the system of another kind.
Liquidity, like Money Supply, is just one small cross-section of that total supply of assets, measuring how many of those assets are cash-like. It has nothing to do with monetary inflation, CPI inflation, or the returns of any assets. The below chart tries to relate liquidity to “monetary inflation hedge” assets. We think the clear lack of correlation between the black and gold lines speaks for itself.

And yet I think the Fed would secretly endorse a chart like that: It yields validity to the idea that the Fed can in fact achieve high inflation if it so desires, by expanding “liquidity”. And the Fed needs the public to be convinced of that, such that the “expectations channel of monetary policy” can overcome the Fed’s mechanical inability to inflate. The Fed needs the “money printer go brrr” meme to exist, because without it, the Fed would be correctly perceived to lack a money printer.

Any measure of “liquidity” that conflates liquidity-by-asset-creation with liquidity-by-asset-swaps necessarily mixes together distinct concepts.
The two operations that are only liquidity-by-asset-swaps are 1) QE, and 2) whether the Treasury “funds” its spending via bills or bonds. These are asset swaps, not asset creations, which means they’re fundamentally not inflationary, even if they raise the supply of cash-like assets. We hit these in sections 2 and 3.
1. What Howell is talking about with “liquidity”
As I mentioned at the top, Howell would characterize liquidity as “the flow of cash-like assets through the financial economy which ultimately drive asset returns.”
Cash-like assets refer to assets that have zero duration and zero credit risk, that is, they can be seen as effective substitutes to a paper note. These various assets all add up to an aggregate measure of liquidity, as I’ve depicted with this bucket.

The first watch-out-for here is that we must center any analysis of “liquidity” on balance sheets, in a T-Account format, that recognizes that all assets have a corresponding liability. Howell provides this description of liquidity:
In this framework, generic asset prices (P) have two moving parts: (1) a pool of liquidity (L), and (2) the allocation of this liquidity to assets (P/L).
Except liquidity is not some separate substance that can be applied to assets. Liquidity is itself one type of asset-liability pair. In particular, liquidity is any asset-liability pair where both the asset and liability are zero-duration, such as a reserve-deposit pair on a bank’s balance sheet. In contrast, with a loan-deposit asset-liability pair, the loan is not zero-duration while the deposit is. The idea that “liquidity can be allocated to assets” is like saying “I’ll allocate my bonds to my stocks”.
Liquidity is simply a measure of how many asset-liability pairs meet a specific criteria: both the asset and liability are zero-duration.
The T-Accounts approach highlights that all liquidity is not created equal just as all liabilities are not the same:
Some cash-like assets come into existence via balance sheet expansion, others merely through balance sheet “alteration”.
Howell identifies central banks and commercial banks as sources of liquidity in his Substack piece:
An increase in liquidity can arise through Central Bank policy actions, as well as from lending decisions of private sector credit providers.
Central Banks and commercial banks create liquidity in completely different ways. Central banks “alter” balance sheets bw swapping less liquid assets with more liquid ones. Commercial banks expand balance sheets.
Whether central banks are altering private balance sheets to make them more liquid has no effect on commercial banks’ willingness to lend.

When cash-like assets come into existence via balance sheet “alteration” (asset swaps) rather than balance sheet expansion (asset creation), it is not supportive to NGDP, which means it is not a driver of asset returns.
The idea of “Fed Net Liquidity” (the red line in the first chart) serves as a great example of this distinction.

In this Blockworks interview, Howell clarifies the distinction between broad liquidity and Fed liquidity:
“Liquidity in our terms is a measure of balance sheet capacity. It’s not the traditional M1 or M2 people look at. It’s not this concept of Fed liquidity that is airing on Twitter… Some of those factors are included in our metric, but liquidity broadly is money in the financial markets. It’s not just money that is contributed by banks; we look at central banks, conventional banks, and shadow banks.”
To summarize, “Fed Net Liquidity” is one of many types of liquid assets that make up the “Liquidity” bucket.
Later on in the interview, Howell reinforces this idea:
“People completely dismiss the role of central banks, which is clearly wrong. There’s been a number of accounts on Twitter that say that central banks don’t matter, and that reserves are a spurious concept. That’s clearly not true. Central banks are important, but they are a part of the puzzle.”
We at TMF are two of those accounts that think reserves don’t matter, and a simple asset-liability analysis reveals as much.
Fed net liquidity, conceptually, refers to Fed liabilities, i.e. reserves, that are actively sitting in the banking system, rather than in one of a few “sinks”, those being the Fed’s reverse repo program or the Treasury General Account.
“Fed net liquidity” increases every time the Fed purchases a bond from a bank, replacing that bond with reserves:

This is an example of balance sheet alteration: The commercial bank didn’t expand its balance sheet, it just changed its composition. That the Fed expanded its balance sheet doesn’t matter. The bank is no more profitable or valuable now than it was prior to the transaction, so neither is the private sector as a whole.
In contrast, below is an example of the creation of cash-like assets that involves the expansion of the private sector balance sheets, in which a commercial bank makes a loan.
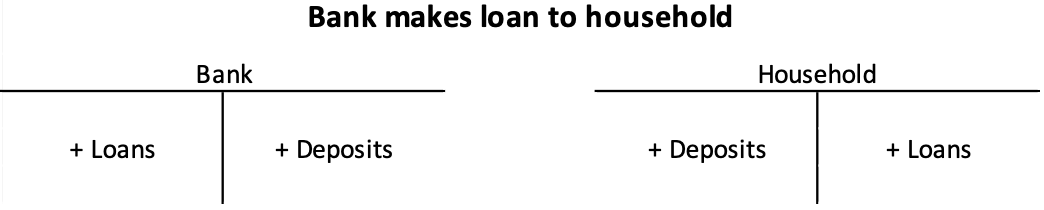
In this case, cash-like assets (deposits) have come into existence via private balance sheet expansion, which raises the supply of funds available for spending, which would contribute to NGDP.
The increases in the supply of cash-like assets from balance sheet expansion, versus balance sheet “alteration”, are categorically different. Lumping them into the same bucket is how we end up with metrics like “liquidity” that aren’t useful for understanding economic conditions.
2. Fed Net Liquidity isn’t a useful concept
Because Fed net liquidity tracks cash-like assets that have come into existence through the private sector re-composing its balance sheet rather than expanding it, the metric isn’t meaningful.
Below I’ve shown a few cuts at items on the Fed’s balance sheet: Comparing the red and blue lines shows that the Fed’s asset side has been coming down since 2022, but “Fed net liquidity” has been rising since early 2023, due to the TGA drawing down without being refilled and the RRP drawing down, both of which send reserves into the banking system.

But again, what drives asset returns isn’t how many reserves are sitting in the banking system, it’s how many total reserve-deposit, loan-deposit, or Treasury security-deposit asset-liability pairs are sitting on bank balance sheets, because that determines the potential spending available to the real economy. And spending is what actually drives asset returns.
Whether a particular asset-liability pair is a reserve-deposit pair or a T-Bond-deposit pair doesn’t matter.
When we extend the chart of stocks and “Fed net liquidity” further back, it becomes evident how unrelated the two measures actually are.


Including “Fed net liquidity” in any measure of broad liquidity subjects that broad liquidity measure to the classic traps of money supply measures like M1 and M2: they include things that they shouldn’t be including, and exclude things they should be including, making these measures ineffectual.
Any measure of broad “liquidity” that includes all three of Fed reserve creation, Treasury spending and issuance, and bank loan creation, necessarily mixes together apples and oranges.
In this section, we discussed why “Fed net liquidity”, or what I will now call “Powell liquidity”, effectively doesn’t really matter. In the next section, I discuss why the other example of “liquidity by balance sheet alteration”, “Yellen liquidity”, similarly doesn’t matter.
3. Powell liquidity, Yellen liquidity, Biden liquidity. Not all liquidity is created equal.
Just like how “Fed net liquidity” is frequently highlighted as evidence of resumed monetary inflation, the Treasury’s recent preference towards bills is seen as another source of rising liquidity.

The choice of maturity to issue government debt is as important as “Fed net liquidity”: that is, not that important. Again, it’s because that issuance is just a swap of assets, not an expansion of assets.
I call the Treasury’s issuance choices “Yellen liquidity”.
Powell and Yellen cannot produce a monetary inflation, because they can only increase “liquidity” by replacing an already-existing asset with a cash-like asset. And monetary inflation is an expansion of assets, not a swap of assets.
Below we’ll work through those mechanics. These three buckets make up the total supply of assets. To produce a monetary inflation, you have to add to one or more of these buckets.

“Liquidity” describes the size of the Liquidity bucket. If the Liquidity bucket is growing while another bucket is shrinking, then the capacity for nominal growth is not rising.
Powell cannot add more to one bucket without removing from another bucket. With QE, he can only swap bonds for reserves. (Note: If the Fed offers more in reserves than what the asset they’re buying is worth, then it is a monetary inflation. The BTFP was one example of this.)
Yellen also cannot add more to one bucket without removing from another bucket. She can only either swap bond issuance with bill issuance, or swap bank reserves for T-bills.
Biden is different. He can actually inflate, fiscally inflate, by adding new asset-liability pairs to the private sector when he (Congress) chooses to spend. Below we walk through a balance sheet example of this crucial difference.
In this Blockworks interview, Howell discusses what he sees as the liquidity-enhancing effects of the Treasury’s decision to issue more bills and fewer bonds:
“What are the implications of the Treasury issuing lots of bills, and of that Treasury issuance being bought by credit providers like banks? If, for example, a pension fund buys a treasury security of any stripe, a bill or a bond, that will not increase the size of the credit provider’s balance sheets, so liquidity would not increase. This is a source of funding that is not monetization.
If the banks buy a T-Bill it will expand their balance sheet, and that is monetization and increases liquidity. If the bank’s balance sheet expands, it is providing liquidity into the financial markets.”
In our view, the question of whether Yellen issues bonds or bills, and whether they’re bought by banks or non-banks, is much ado about nothing. No matter what happens, the first consideration is always that the government spent money. That spending is a true monetary inflation, because it expands the supply of asset-liability pairs.
Breaking it down:
Howell says that only when a bank purchases the T-Bill is liquidity increased, because the private sector expanded its balance sheet to fund the purchase, whereas a pension fund just recomposes its balance sheet when it funds a T-Bill purchase:


But this process is secondary to what actually happened first: the government spent money into existence, and that was when the monetary inflation occurred as the supply of asset-liability pairs expanded. The fact that the government then replaces some of that money with Treasury securities is secondary.
In other words, the thing that was actually inflationary and liquidity-expanding was that the equity of the private sector rose when the government spent, as shown in the below example:

Steps 1 (the financing of the spending) and 2 (the spending) are actually independent and don’t even occur in that order. One is not necessary for the other. The important thing is that the government spent, raising the wealth of the private sector. The Treasury’s issuance of debt is merely an asset swap.
The same applies if a pension fund instead buys the Treasury:

I have “funds” in quotes in the titles, because again, the spending happens independently of the funding of the spending.
So, whatever Yellen chooses to do after the spending, or whether banks or pension funds buy that debt, doesn’t matter relative to the fact that nominal GDP is likely to rise as that money gets spent into the economy, which is bullish for assets.
Powell and Yellen cannot increase the total supply of assets. Money printing is exclusively the increase in total supply of assets. Therefore, neither Powell nor Yellen can produce a monetary inflation via monetary operations.
4. Arriving at our “Total Impulse” metric as a preferable measure of inflationary money
Hopefully, the above discussion of asset swaps versus asset creations clarified why it’s not the supply of cash-cash asset-liability pairs that matter (liquidity), it’s the supply of total asset-liability pairs that matters.
There’s only two ways our current monetary system can expand that supply of assets: deficit spending and bank lending. The Treasury’s issuance choices are irrelevant to both of those. The Fed’s interest rate policy influences both, but in opposite directions, complicating the interest rate-channel of monetary policy.
To capture those sources of new money, we’ve been tracking the excess fiscal and monetary impulses since Covid, and have shared those measures many times on TMF.

Combining the fiscal and monetary impulses, we get a “total impulse”, which is the flow of new asset-liability pairs to the economy in excess of the pre-pandemic trend. Note that we don’t care about how many of those assets are reserves, T-Bills, or any particular “liquid” asset.
Adding “Fed Net Liquidity” or any other measure of liquidity to our Total Impulse would clearly be fitting a round peg in a square hole. Liquidity is a measure of how many assets meet a given criteria. We care about the total number of assets.
Based on our tracking, the US economy is still on a path of solid nominal growth supported by large budget deficits. We are certainly not concerned about any immediate need to buy “monetary hedge” assets.
There is no real monetary danger to hedge against, and we think it’s important to recognize that any claim that there is a monetary danger is describing a tail outcome, and making a business out of selling protection against it. We at TMF are seeking to describe reality.
Once again, if folks enjoy these deep-dive comparisons of macro frameworks, let us know, especially if you have an idea for what you’d like us to discuss next. Until next time.
A lot to digest! Look forward to going over this numerous times in next few weeks! Maybe I shld audit an accounting course too. Good stuff on the 'pairs' and the diff tween Powell Yellen and Biden!
As for another show. I'd like to hear how yall would see ramifications in fiscal flows and stocks etc for a Biden win in Nov vs a Trump win just assuming what they'd most likely would want to 'spend into existence ' along with Congress.
Thanks
I am reading this piece a few months after the fact, but I was hoping you could explain in more detail what you mean when you call bitcoin a "monetary hedge?"